

Dinesh M.L1, Shasindrau B.R2, Lavinan Gukacumaran2
Authors:
2Department of Medical Imaging, Faculty of Health Sciences, KPJ Healthcare University College, Negeri Sembilan, Malaysia
Corresponding Author:
1Department of Medical Imaging, Faculty of Health Sciences, KPJ Healthcare University College, Negeri Sembilan, Malaysia, Mail Id: dinesh@kpjuc.edu.my
ABSTRACT
| Background of the Study: One of the most significant risk factors for non-alcoholic fatty liver disease is physical inactivity. Non-alcoholic fatty liver disease is the most common condition among chronic liver disorders globally. Early diagnosis of non-alcoholic fatty liver disease plays a vital role in the awareness of the condition, its severity, and the preventive care plan. This study aims to determine the level of physical activity among residents of a private educational Institution in Nilai, Negeri Sembilan, Malaysia. Methodology: The short form of the International Physical Activity Questionnaire (IPAQ) and the Demographic Questionnaire was used to conduct a cross-sectional study. A convenience sample of 162 respondents voluntarily participated in the study. Of the 162 respondents analysed, 73 (45.1 %) were found to have a low level of PA (mean: 1.75; SD: 3.14; p<0.05). Result: The observations revealed that the amount of PA decreases with age and that younger adults have more PA than older adults (p<0.05), as well as women have a low level of PA compared to men (p<0.05). The findings also demonstrate a meaningful relationship with the low PA level between occupational status and educational levels (p<0.05). 34 (70.8 %) of the 73 low PA participants were obese, with a significant difference from other BMI groups(p<0.05). Conclusion: This research concluded that most of our respondents followed a sedentary lifestyle with physical inactivity and a clear demographic relationship. Therefore, it is believed that nutritionists and sports experts should plan programmers and tools within the university community. It can provide residents with assistance in choosing appropriate physical activities with improved healthy governance. Keywords: Physical Activity, BMI, Demographic, Non-Alcoholic, Fatty Liver Disease. |
| Received on 20th January 2021, Revised on 5th February 2021, Accepted on 25th February 2021; DOI:10.36678/IJMAES.2021.V07I01.004 |
INTRODUCTION
Non-Alcoholic Fatty Liver Disease (NAFLD) is characterised by increased accumulation of hepatic triglycerides (TG) occurring in the absolute lack of excessive alcoholism, which is greater than 20g in a day1. In developed and developing countries, NAFLD is the most common ailment among chronic liver disorders2. Most patients are asymptomatic, while fatigue, dyspepsia, right upper quadrant pain, and hepato-splenomegaly may occur in some3. The prevalence of NAFLD is 36.8 % in the Mediterranean region, 5 %-24 % in China, 20 %-40 % in Europe, 9 %-30 % in Japan, 16 %-32 % in Indian urban areas, and 9 % in Indian rural areas, according to the results of previous studies in various parts of the world. In Asian countries, Singapore has the lowest prevalence rate of 5 %4. Meanwhile, a prevalence of 22.7 % among individuals attending a health check in a suburban medical facility was reported in the published study on the prevalence of NAFLD in the general population of Malaysia5.
The leading cause of end-stage liver disease requiring liver transplantation is predicted to be NAFLD by 20206. Because of the increasing prevalence of obesity and metabolic syndrome, NAFLD will become one of the most critical public health challenges in the coming decades due to its related complications. In about 20-25% of cases, simple NAFLD can progress to non-alcoholic steatohepatitis (NASH), and nearly 20% of NASH patients can develop fibrosis and cirrhosis7. Twenty-six per cent of all NAFLD patients have been reported to have had liver cirrhosis for ten years or more, and about 12% of NAFLD patients die from liver-related causes8. An increased risk of chronic kidney disease has recently been associated with NAFLD9. Thus, early diagnosis, treatment, and NAFLD management are absolutely vital to achieving a satisfactory patient outcome. Diabetes mellitus (DM) and obesity are closely related to NAFLD. In patients with DM, the prevalence of NAFLD is greater. In previous research from other parts of the world10, it has been estimated to be between 55 % and 70 %. Among the morbidly obese, the prevalence of NAFLD is even greater11 and has been reported to be over 90%.
The critical component of metabolic syndrome and NAFLD is Diabetes Mellitus (DM)12. NAFLD is directly linked to insulin resistance. The race of the Asian population is a risk factor for diabetes mellitus and obesity. Over the years, the prevalence of DM and obesity in Malaysia has reached epidemic proportions. The Third National Health and Morbidity Survey (NHMS III) by the Ministry of Health Malaysia estimated that the prevalence of DM among adults aged 30 and above nearly doubled from 8.3 % to 14.9 % in 2006. The Fourth NHMS found that in 2011 this figure rose to 20%. The main reason for fluctuations in the signalling of hepatic insulin and accompanying NAFLD could also be physical inactivity. According to DeSouza et al. (2010), obese types of NAFLD had inhibited signalling of insulin from the liver when studied under a physically inactive cage environment. However, the obese mice showed significant increases in hepatic insulin signalling after one acute exercise session (swimming)13. It indicates that obesity is often not the main defect triggering resistance to hepatic insulin, but the combination of sedentary circumstances and obesity may be the reason.
Physical inactivity and NAFLD are closely related, yet most of the findings obtained from cross-sectional analyses are unfortunately only relational. Among the first experiments to confirm that reduced daily PA levels were correlated with greater NAFLD incidence was Hsieh et al. (1998)14(≤ 1 day/wkvs≥ 3 days/wk). A study by Katsagoni and colleagues, who reported data using the PA level as the continuous variable15, showed that NAFLD odds were reduced by 26 % for every 100 MET minutes/day incrementally higher PA (OR 0.74, 95% CI 0.61-0.89); alternatively, a 19% reduction per 500 MET minutes/week incrementally higher PA (OR 0.81, 95% CI 0.70-0.92). In a study by Qiu S et al. (2017), it is also mentioned that increased PA could be dose-dependently associated with a lower risk of adult NAFLD16.
MATERIALS AND METHODS
Study design and population : A cross-sectional study design was chosen for this research. The percentage of PA levels among the residents of a private University, Malaysia, would be identified in this study design. The study was carried out from March 2019 to September 2020.The study population consists of all the residents of the university includes all students and staff.
Study respondents will be selected regardless of their gender, educational backgrounds/fields, different ethnicities, and BMI range from all disciplines. The age range between 15-64 years was selected for this study. The study would determine the level of PA and correlate with age, gender, education level, occupational status and Body Mass Index (BMI).
Data collection tools
The process of collecting data began in December 2019 and spanned for six months. During the data collection, survey respondents were given brief explanations of the study information and consented to it. The online questionnaire consists of two sections: part A, the respondents’ demographic data and BMI; part B is the International PA Questionnaire (IPAQ., 1998)17, which was used to quantify the health-related PA of respondents.
Data collection process
The study was conducted by distributing the validated questionnaire via Google form to the respondents who meet the inclusion criteria during data collection periods. The purpose and the instructions of the questionnaire have been explained briefly to the respondents. During the data collection process, the respondents were asked to complete all the demographic data questions includes age, gender, education level, occupational status, height and weight (Part A) and the International PA Questionnaire (Part B). Responses have been collected online (Google Forms) after completing all the items in the questionnaires.
Statistical analysis
The collected data were analysed using the statistical software package SPSS (version 25, IBM Corp.) and version 19 of Microsoft Excel (Microsoft Office 365). The data were analysed by using a descriptive statistical analysis. Pearson’s chi-square test was carried out to compare and identify the relationship between the levels of PA and demographic factors.
The single categorical variable was analysed using a one-sample proportion test. The level of statistical significance was set as p < 0.05. Note that, due to rounding, reported percentages may not add up to 100 per cent. Categorical variables are displayed as percentages and numbers.
RESULTS
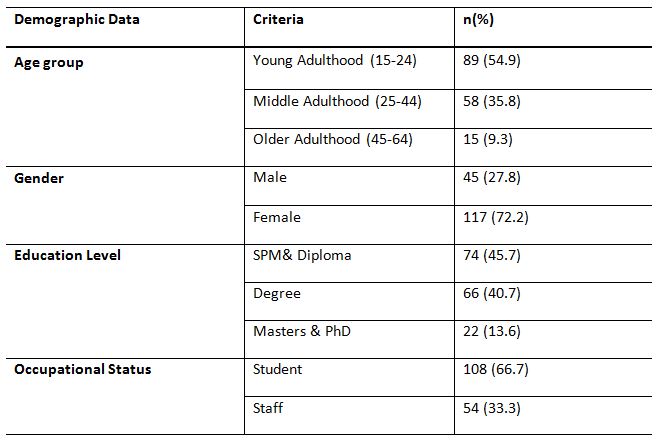
A total of 162 responses were collected. Table 1 shows the demographic data, and it contains the age group, gender, education level and occupational status, frequency of respondents
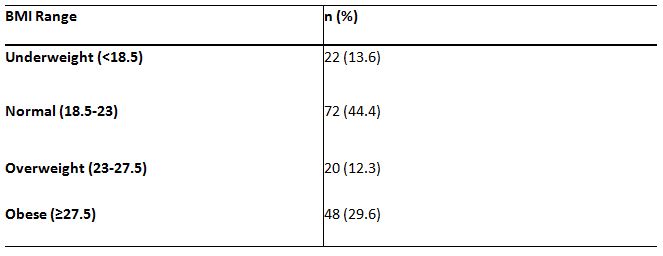
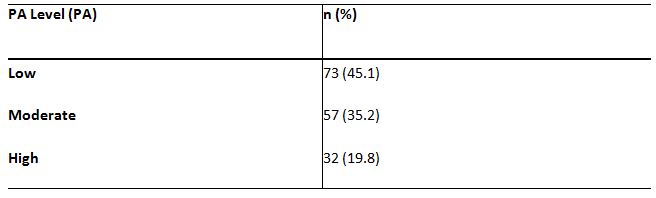
with age groups. Table 2 shows the classification of BMI range and the percentage of responses. Table 3 is representing the PA levels of the respondents.
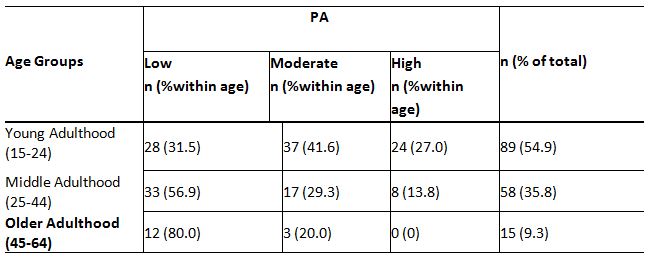
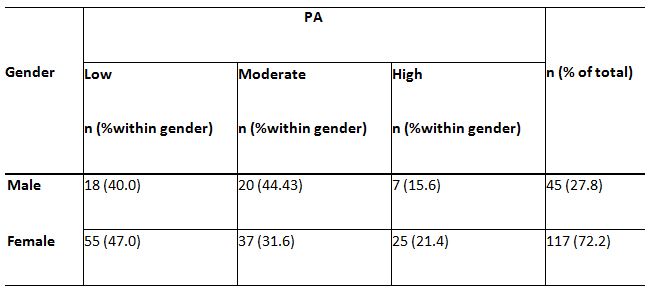
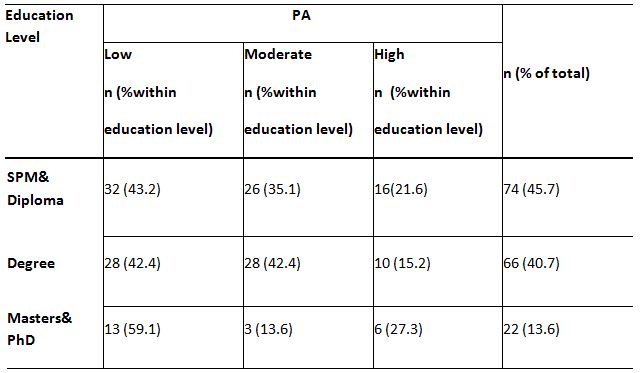
A significant relationship between age and PA levels, c2(4,N = 162) = 18.45, p<0.05, is demonstrated by the findings of this study. The data indicated that with age, the level of PA is reduced, and younger adults have more PA than older adults (p<0.05) (Table 4). The relationship between gender and PA is provided in Table 5, and it exhibited a major relationship between gender and low PA levels, p<0.05. Table 6 shows the percentage of 162 respondents between the educational level and PA, and the results also reveal a significant relationship between the level of education and the low level of PA, c2(2, N = 162) = 8,25, p=0.016.
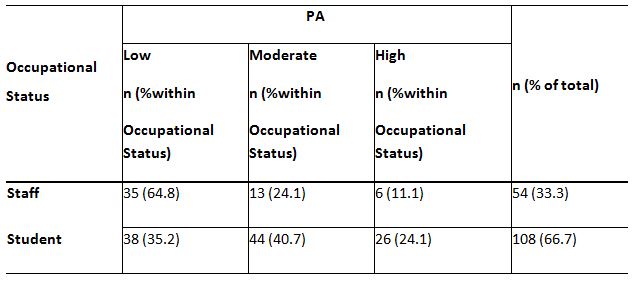
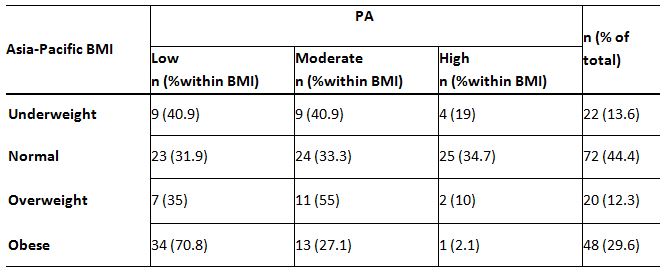
Of the 162 respondents, Table 7 represents the percentage between occupational status and PA level. There is a positive association between occupational status and PA levels in the statistical analysis, c2(2, N = 162) = 12.92, p=0.002. It shows that students were highly engaged in PA than employees (p<0.05). These findings suggest that the normal BMI group (34.7%) has a higher percentage of high-level PA than the obese group (2.1%). It revealed that the correlation between BMI and low PA levels, c2(3, N = 162) = 26.45, p<0.05, is highly significant. It shows that obese individuals had a low PA level than normal BMI individuals (p=0.00),(Table 8).
DISCUSSION
Based on the results of PA levels (low, moderate and high) among respondents of the university, we have found that the majority of the respondents (73) had low PA level with the percentage of 45.1%(mean: 1.75; SD: 3.14; p<0.05). According to a recent study, proposes
that sedentary lifestyles, including physical inactivity, assume a vital role in the advancement of NAFLD18. Related to the latter
statement, the findings of this study show that the majority of the university’s residents had a low level of PA, which was strongly associated with NAFLD factors.
To further support this, the findings of a study imply that a low PA level was autonomously related to NAFLD’s existence. Other than that, we have found that 57 of the respondents had a moderate PA level with a percentage of 35.2%, which has lesser relations to factors associated with NAFLD19. To uphold this, the findings of the study has indicated that the highest and moderate PA levels were better than the low level in diminishing NAFLD risk (p for interaction = 0.006 and 0.02, respectively) 16. Moreover, this study found that a minority of the respondents (32) had a high PA level with 19.8%. According to a study by Qiu et al.(2017)16, aggravated PA was related to a decreased NAFLD risk. Another study stated that their findings of lower risk of NAFLD needed the highest PA level 20.
According to this study, there is a significant relationship between age and PA levels, p=0.001. The results prove that the level of PA is decreased with age and the younger adults engage more PA than older adults (p<0.05). A study was carried out and stated that the prevalence of NAFLD was gradually increased with age advances 21. The study’s finding has shown that 45.1% of respondents from age 45 to 65had very low PA and had a higher prevalence of NAFLD. In contrast, a similar study carried out among diabetic patients at the Diabetic Clinic of University Malaysia (UMMC) had found that the prevalence of NAFLD decline as age increases. Thus, the result of the correlated finding had shown no significant relationship between age and PA22. However, low PA among respondents in this study has a higher likeliness of NAFLD factors as age increases. It may be due to their sedentary lifestyles, where most of the respondents are less likely to be active in physical activities as the age increases. It may occur due to their life commitments, poor time management, neglect of health-related activities, or certain medical conditions.
A study asserted that men transpired higher PA levels than women as far as moderate-ferocity, vigorous-ferocity and utterly free-time PA practice 23. Another study by the Australian Bureau of Statistics (2012) stated that most females do not do adequate health-related activities to profit their wellbeing and prosperity. This statement has further enhanced this study’s findings that female residents (47%) adapted to practising lesser physical activities than males (40%).Comparing the low PA levels with gender, the statistical calculation shows a significant relationship between gender and PA levels, p<0.05.
Medical issues are related firmly, with decreased health-related activities in highly intellectual people. The study also asserted that the positive coefficient of the multiplicative term educational level × age (b = 0.056, p ≤ .001) recommends that the backward relationship between age and health-related activity got more fragile as the educational level rose. The above statement enriched the findings of this study that higher educational level correlates directly with the reduction of PA practices regarding NAFLD factors among the respondents. It shows that around 60% of the respondents from higher education level groups had low PA compared to the low education group 43.2%, p=0.016. Not working and job losses were associated with decreased physical activity for low-education individuals, while the reverse was true for highly educated individuals24.
In this research, to examine the PA associated with NAFLD, the percentage between occupational status and PA was analysed. A notable difference between occupational status and low PA has been found. Compared to the students, a distinctly high percentage of employees (64.8%) had low PA rates (35.2% ). The statistical analysis of this study demonstrates an important relationship between occupational status and PA levels (p = 0.002) and shows that students engage moderate to a high level of PA than employees. According to a recent study a statistically significant association existed between business status and low PA. In contrast with working individuals with moderate to vigorous activity, those who were not working had OR of 1.54 (95% CI: 1.31–1.73). It was mainly due to health governance and socioeconomic contributors25.
The percentage between body mass index (BMI) and PA has revealed a strong association between both variables. Most importantly, there was a significant relationship seen between obesity and PA. The findings of this study observe that as BMI classification increases, the level of PA decreases and NAFLD-related factors increase. In this study, 71% of obese respondents had low PA levels, which was the highest score than other low-PA groups. Contrasted to the obese group (2.1%), the normal BMI group (34.7%) has a greater percentage of high-level PA. It shows that the relationship between BMI and PA levels is highly significant (p < 0.05).Another study showed a strong correlation between PA, body mass index (BMI) and lipid profile among students in Ghana (Ofori et al., 2019)26. On the other hand, PA had a significant association with BMI (p= 0.018), which was higher among participants with a normal BMI range than obese or overweight participants27.Based on the findings in this study, BMI classification acts as a critical factor for high, medium or low PA, which decides the factors related to NAFLD among the respondents.
Ethical Clearance: The Institutional Review Board approved this study with an ethical registration number: (KPJUC/RMC/ SOHS/EC/2019/228) dated 05/09/2019.
Conflicts of Interest: The author declares that there is no competing interest in publishing this article.
Fund for the study: This study is funded by KPJ Healthcare University College, Nilai, Negeri Sembilan, Malaysia.
CONCLUSION
It is concluded that the PA levels in this study were low for the majority of the respondents. Demographic variables such as age, gender, education level, and occupational status were significantly related to PA. There was a high level of physical inactivity and a sedentary lifestyle in the obese group, leading to NAFLD.
Acknowledgement: KPJ Healthcare University College supports this research work [Grant number: KPJUC/RMC/SOHS/EC/2019/228]. The authors also would like to express their sincere gratitude to the participants who took part in the research.
REFERENCES
- Rector RS , Uptergrove GM , Morris EM , Borengasser SJ , Laughlin MH, Booth FW , Thyfault JP , Ibdah JA. (2011). Daily exercise versus caloric restriction for prevention of non-alcoholic fatty liver disease in the OLETF rat model. Am J PhysiolGastrointest Liver Physiol 300: G874–G883.
- Bedogni, G., Nobili, V., &Tiribelli, C. (2014). Epidemiology of fatty liver: An update. In World Journal of Gastroenterology. 20(27): 9050–9054.
- Milić, S., Lulić, D. &Štimac, D. (2014). Non-alcoholic fatty liver disease and obesity: Biochemical, metabolic and clinical presentations. World J. Gastroenterol. 20(28) 9330-9337.
- Sharma, M. et al. (2015). The Riddle of Nonalcoholic Fatty Liver Disease: Progression From Nonalcoholic Fatty Liver to Nonalcoholic Steatohepatitis. Journal of Clinical and Experimental Hepatology. 5(2): 147–158.
- Goh, S. C., Ho, E. L. M., & Goh, K. L. (2013). Prevalence and risk factors of non-alcoholic fatty liver disease in a multiracial suburban Asian population in Malaysia.Hepatology International. 7(2): 548-554.
- Charlton, M. R., Burns, J. M., Pedersen, R. A., Watt, K. D., Heimbach, J. K., &Dierkhising, R. A.(2011). Frequency and outcomes of liver transplantation for non-alcoholic steatohepatitis in the United States. Gastroenterology.141(4): 1249-1253.
- Angulo, P. (2010). Long-term mortality in non-alcoholic fatty liver disease: Is liver histology of any prognostic significance?. Hepatology.51(2):373-375.
- Matteoni, C. A. et al. (1999). Non-alcoholic fatty liver disease: A spectrum of clinical and pathological severity. Gastroenterology. 116(6): 1413-1419
- Marcuccilli, M. &Chonchol, M. (2016). NAFLD and chronic kidney disease. International Journal of Molecular Sciences.17(4):562.
- Leite, N. C., Salles, G. F., Araujo, A. L. E., Villela-Nogueira, C. A., & Cardoso, C. R. L. (2009). Prevalence and associated factors of non-alcoholic fatty liver disease in patients with type-2 diabetes mellitus. Liver International. 29(1): 113–119.
- Machado, M., Marques-Vidal, P., & Cortez-Pinto, H. (2006). Hepatic histology in obese patients undergoing bariatric surgery. Journal of Hepatology. 45(4): 600–606.
- Ramachandran, A. (2012). Trends in prevalence of diabetes in Asian countries. World Journal of Diabetes. 3(6):110.
- De Souza, C. T., Frederico, M. J. S., da Luz, G., Cintra, D. E., Ropelle, E. R., Pauli, J. R., &Velloso, L. A. (2010). Acute exercise reduces hepatic glucose production through inhibition of the Foxo1/HNF-4α pathway in insulin resistant mice. Journal of Physiology. 588(12): 2239–2253.
- Hsieh, S. D., Yoshinaga, H., Muto, T., & Sakurai, Y. (1998). Regular physical activity and coronary risk factors in Japanese men. Circulation. 97(7): 661–665.
- Katsagoni, C. N. et al. (2017).Associations between Lifestyle Characteristics and the Presence of Nonalcoholic Fatty Liver Disease: A Case-Control Study. Metabolic Syndrome and Related Disorders. 15(2): 72–79.
- Qiu, S. et al. (2017). Association between physical activity and risk of non-alcoholic fatty liver disease: A meta-analysis. Therapeutic Advances in Gastroenterology. 10(9): 701–713.
- IPAQ.(2002).(International Physical Activity Questionnaire) http://www. ipaq. ki.se/ downloads. International Physical Activity Questionnaire.
- Marchesini, G. et al. (2016). EASL-EASD-EASO Clinical Practice Guidelines for the management of non-alcoholic fatty liver disease. Journal of Hepatology. 64(6): 1388–1402.
- Jang, Lee, Lee, & Kim. (2019). Independent Association of Physical Activity with Nonalcoholic Fatty Liver Disease and Alanine Aminotransferase Levels. Journal of Clinical Medicine. 8(7): 1013.
- Hallsworth, K. et al. (2015). Non-alcoholic fatty liver disease is associated with higher levels of objectively measured sedentary behaviour and lower levels of physical activity than matched healthy controls. Frontline Gastroenterology. 6(1): 44–51.
- Khammas, A. S. A. et al. (2019). Prevalence and risk factors of sonographically detected non alcoholic fatty liver disease in a screening centre in Klang Valley, Malaysia: an observational cross-sectional study. Porto Biomedical Journal. 4(2): e31.
- Chan, Y. Y. et al. (2017). Physical activity and overweight/obesity among Malaysian adults: Findings from the 2015 National Health and morbidity survey (NHMS). BMC Public Health. BioMed Central Ltd. 17(1):733.
- Azevedo, M. R. et al. (2007) Gender differences in leisure-time physical activity. International Journal of Public Health. 52(1): 8–15.
| Citation: Dinesh M.L, Shasindrau B.R, Lavinan Gukacumaran(2021). A cross-sectional study of the risk factors of non-alcoholic fatty liver disease: Physical activity levels among the residents of a private teaching Institution, ijmaes; 7 (1); 943-953. |
Leave a Reply